California has long been a testbed for renewable energy policy, but the first five months of 2026 mark a definitive turning point. Data from the California Independent System Operator (CAISO) shows that utility-scale solar generation has surpassed natural gas for the first time on a sustained multi-month basis. This isn't a single-day anomaly or a seasonal blip; it's a structural shift driven by capacity additions, battery deployment, and changing grid economics.
For energy analysts and climate observers, the numbers tell a clear story. Solar output increased 21% compared to the same period in 2024, while natural gas generation fell by a remarkable 60%. Perhaps most tellingly, solar outperformed gas on 82% of days in the first five months of 2026 — a dramatic jump from just 21% in both 2024 and 2025. This shift reflects the compounding effect of renewable deployment and the growing ability of batteries to shift afternoon solar into evening demand peaks.
The implications extend well beyond California's borders. The CAISO grid is one of the largest in North America, serving roughly 30 million people. What happens here — the integration challenges, the market dynamics, the policy lessons — offers a live demonstration for grid operators in Texas, Europe, and Asia who are navigating similar transitions. The data also reveals a more complex picture involving electricity imports, hydro recovery in the Pacific Northwest, and even the arrival of wind power from New Mexico's SunZia project.
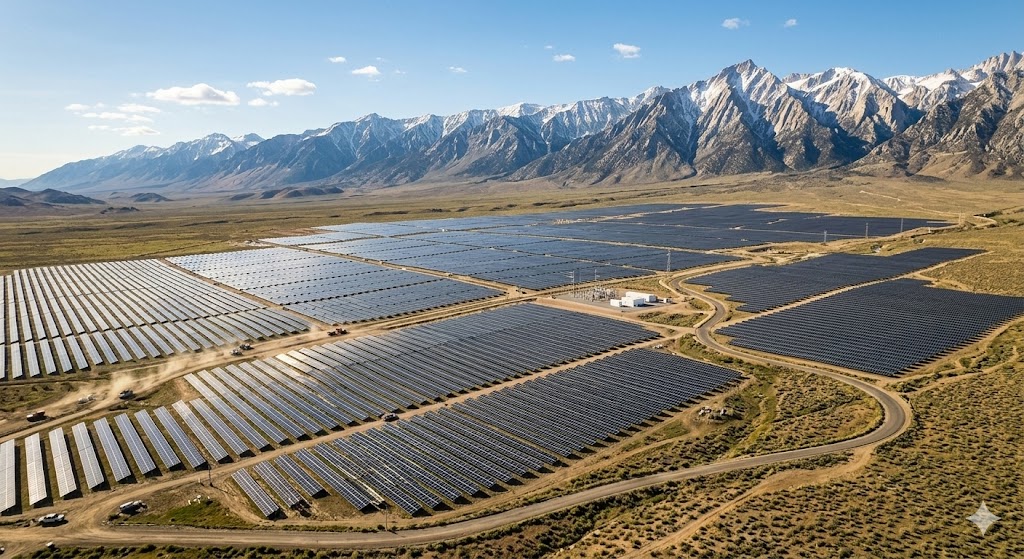 The raw numbers from CAISO's Hourly Electric Grid Monitor reveal the scale of change. Between April 2024 and April 2026, utility-scale solar capacity grew 19% to 25 gigawatts (GW), while net battery storage capacity surged 79% to 16 GW. Natural gas capacity remained essentially flat at 29 GW, and total net capacity increased 14% (11 GW) over the period.
Table 1: CAISO Capacity Changes (April 2024 – April 2026)
| Technology | Capacity (April 2024) | Capacity (April 2026) | Change | % Change |
|---|---|---|---|---|
| Utility-Scale Solar | 21 GW | 25 GW | +4 GW | +19% |
| Battery Storage (Net) | 9 GW | 16 GW | +7 GW | +79% |
| Natural Gas | 29 GW | 29 GW | 0 GW | 0% |
| Total Net Capacity | 78 GW | 89 GW | +11 GW | +14% |
Table 2: CAISO Generation Comparison (January–May, 2024 vs 2026)
| Metric | 2024 | 2026 | Change |
|---|---|---|---|
| Solar Generation (GWh) | ~18,500 | ~22,400 | +21% |
| Natural Gas Generation (GWh) | ~21,300 | ~8,500 | -60% |
| Battery Discharge (GWh) | ~2,100 | ~6,300 | +200% |
| Net Electricity Imports | Baseline | ~2x Baseline | +100% |
| Total Demand | Baseline | +7% | +7% |
Note: Values are approximate based on percentage changes reported in the source data. GWh figures are estimates derived from published CAISO data and should be treated as directional.
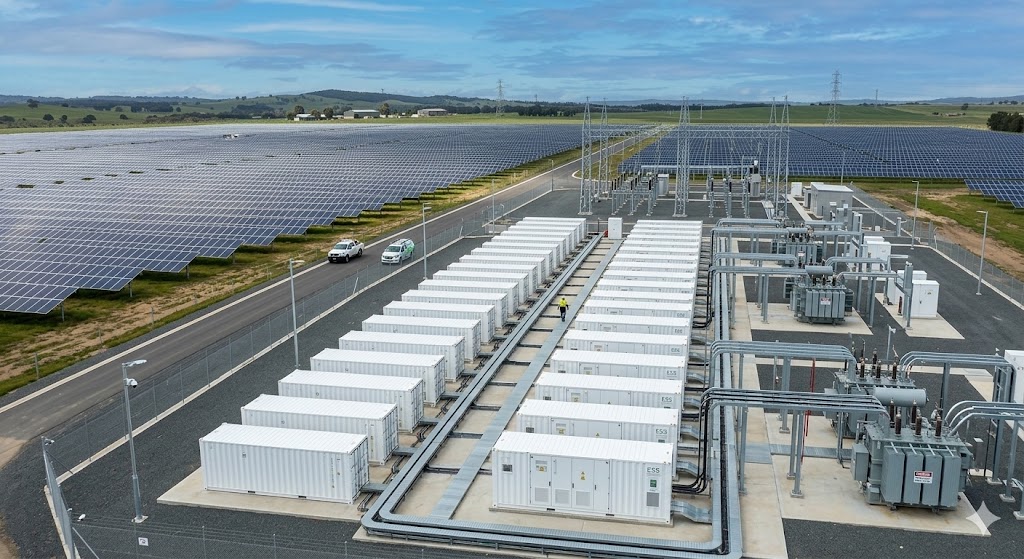 The rise of solar and batteries in CAISO isn't just about adding clean capacity — it's fundamentally changing how the grid operates. The daily generation curve in California now resembles a "duck curve" on steroids. Midday solar peaks push net demand down to record lows, while evening ramps require fast-responding resources. Batteries have stepped into that gap. In the first five months of 2026, battery discharge tripled compared to the same period in 2024, providing critical power during evening peaks and early morning hours when solar output is zero or minimal.
The Role of Battery Storage in Grid Transformation
Battery storage is the enabling technology that turns intermittent solar into a dispatchable resource. When co-located with solar farms, batteries charge during the midday oversupply period and discharge when grid needs rise. This does more than shift energy; it reduces curtailment, stabilizes prices, and displaces gas-fired peaker plants. The 79% growth in battery capacity to 16 GW is perhaps the single most important data point in this analysis. California now has more grid-scale battery capacity than many entire countries have in total generation capacity.
The economics of this transition are becoming self-reinforcing. As solar and batteries capture a larger share of the market, gas plants run fewer hours, making them less economical to maintain. This creates a virtuous cycle where renewables become more competitive and gas becomes less viable. The flat natural gas capacity of 29 GW suggests that while no major retirements have occurred, no new gas plants are being built either. The 555 MW of retirements between May 2024 and May 2025 included a 300 MW battery facility that caught fire in January 2025 — a reminder that even the transition itself has operational risks.
The Surprising Role of Imports in California's Clean Energy Mix
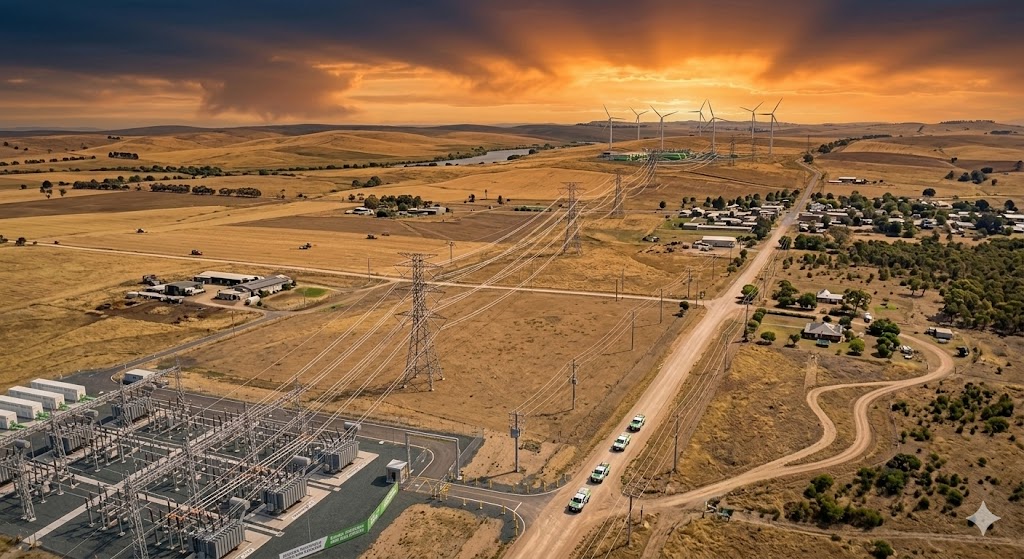
One of the more counterintuitive findings in the CAISO data is the 19% decrease in net generation despite a 7% increase in demand. The gap is filled by electricity imports, which doubled over the period. This isn't a retreat from clean energy; it's a regional optimization. The Pacific Northwest's hydroelectric output has recovered as drought conditions eased, providing low-cost, low-carbon power. More notably, CAISO began importing from the SunZia wind project in New Mexico starting in April 2026 — the largest wind project in the Western Hemisphere. This 3.5 GW project sends clean power across a 550-mile transmission line, effectively making California's grid part of a broader Western clean energy network.
The import strategy raises important questions about grid planning. While California is building solar and batteries at an impressive pace, it's also leveraging the resources of neighboring states. This regional approach to renewable energy is likely to become more common as states and countries realize that no single jurisdiction can optimize its grid in isolation. The implications for transmission planning, market design, and interstate cooperation are profound.
 The CAISO data from early 2026 provides the clearest evidence yet that the energy transition is not just a policy aspiration but a physical reality. Solar generation surpassing natural gas on a sustained basis, battery storage growing nearly 80% in two years, and the integration of out-of-state wind resources all point to a grid that is fundamentally different from even two years ago. The 60% decline in gas generation is not a marginal change; it's a collapse driven by economics, technology, and policy alignment.
Perhaps the most important takeaway is the role of batteries as the linchpin of the transition. Without the 16 GW of storage, the solar surge would face severe curtailment, and gas plants would still be needed for evening peaks. The tripling of battery discharge demonstrates that storage is not just a niche technology but a core grid asset. As battery costs continue to decline and capacity expands, the pace of gas displacement is likely to accelerate further.
For grid operators and energy planners worldwide, California offers a replicable model. The combination of aggressive solar deployment, battery co-location, regional imports, and supportive policy frameworks creates a blueprint for decarbonization. The challenges remain substantial — grid resilience, extreme weather events, and the need for long-duration storage — but the trajectory is unmistakable. California has crossed a threshold, and the data proves that a modern, clean grid is not only possible but already operating at scale.
Sources & References:
"The Strategic Retreat Why Detroit is Backing Away from EVs Despite Billions in Investment"